JAMon comes with the jamon.war web application. This application allows developers to view JAMon statistics and manage JAMon. The main menu can be accessed at http://host:port/jamon/. See the online help in the JAMon web application for more information. The home screen follows.

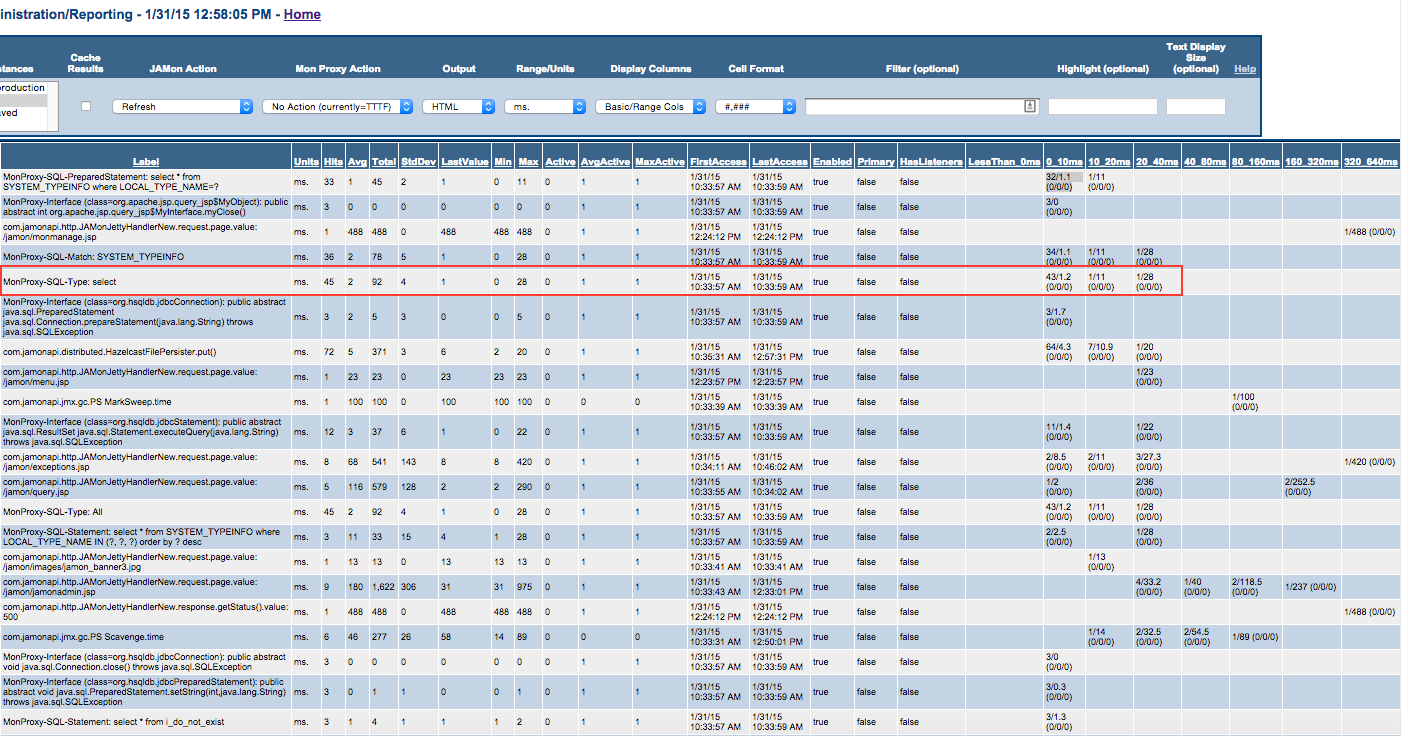
jamonadmin.jsp allows you to view/query the JAMon statistics via a sortable HTML report, XML or an Excel spreadsheet. To view JAMon statistics you must put the jamon jar file in your server's classpath and configure your server. A snapshot of jamonadmin.jsp follows.

jamonadmin.jsp above displays aggregate statistics such as hits, average, min, max and others. JAMon also has the concept of ranges that allow developers to see a better breakdown of the monitoring data. For example the screen snapshot below shows different ranges associated with all monitors with 'ms.' units.
As an example the SQL select statement (monitor label 'MonProxy-SQL-Type: select') was executed 45 times and averaged 2 ms. By looking at the 14 range columns (LessThan_0ms, 0_10ms, 10_20ms, 20_40ms...) you can see this further breaks down to
Ranges combined with JAMon listeners (which let you see the details of individual invocations) are a great way to help you better see the anomalies in your data.
![]()